How To Calculate Marketing ROI
If you’ve been following our content or working with us, you know we’re all about cutting through the fluff in marketing. Over 15+ years in this game, spanning marketing, design, and software dev, we’ve seen a ton of businesses struggle with one core thing: figuring out what’s actually working in their marketing efforts. We get asked about this all the time, whether you’re running your own campaigns, overseeing a marketing department, or partnering with an agency like ours. People want to know: what metrics should I be tracking? How do I extract real insights? And why does it feel like I’m drowning in data but still flying blind?
We recently put together a video to illustrate this, and it sparked a lot of great conversations. Let’s break it down step by step, and by the end, you’ll have a blueprint for building your own measurement system that ties directly to your bottom line.
The Big Problem: You’re Probably Measuring the Wrong Stuff (And How to Fix It)
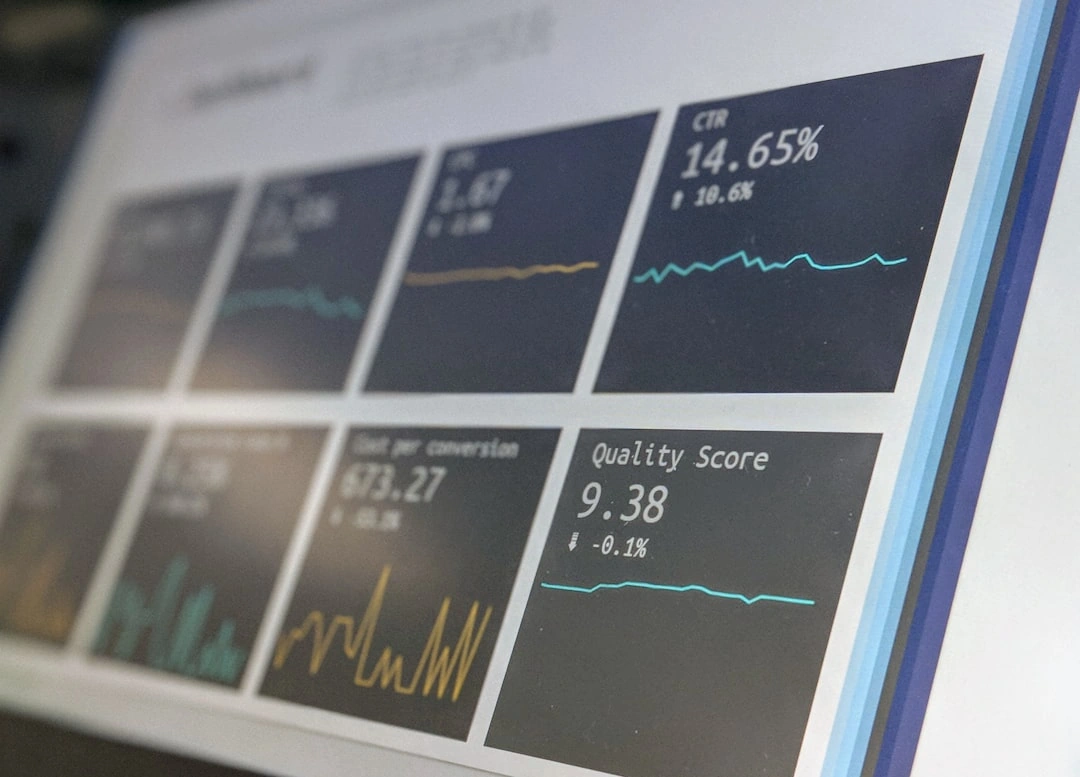
First off, let’s address the elephant in the room. Most folks we talk to are measuring the wrong things. It’s not their fault; marketing platforms love to shove vanity metrics in your face like impressions, clicks, and likes because they make everything look shiny. But those don’t tell you squat about whether your efforts are paying off.
Why does this happen? Two main reasons:
- You Don’t Know What to Measure: If you’re new to this or stretched thin, it’s easy to default to what’s easy. Google Ads shows you click-through rates (CTR)? Cool, track that. Facebook gives engagement stats? Must be important, right? Wrong. These are surface-level. They might indicate interest, but they don’t connect to revenue or growth.
- You Lack the Capacity: Even if you know better, setting up proper tracking is a pain. You need tools that talk to each other: end-to-end attribution that follows a user from first ad click to final purchase. Without it, you’re piecing together puzzles from different boxes. For example, if you’re running Google Ads and only looking at their dashboard, you’re missing how those leads interact with your email nurture sequence or organic content.
The fix? Shift your mindset to outcome-focused metrics. Think about your business goals first. Are you an e-commerce store chasing sales? A SaaS company hunting subscriptions? A service business after qualified leads? Your key performance indicators (KPIs) should ladder up to those. In our video, we used a dummy dashboard for an e-com setup, but the principles apply everywhere. Let’s start with the fundamentals.
Core Metrics: The Top-Line Stuff That Actually Matters
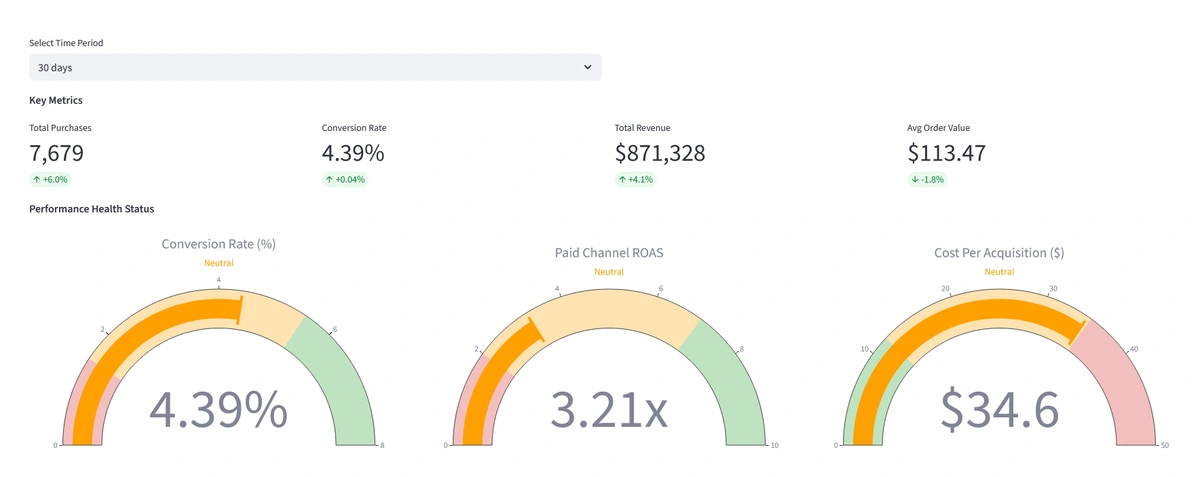
At the highest level, your dashboard should give you an at-a-glance view of health. Here’s what we recommend prioritizing; tailor these to your biz, but don’t overcomplicate it.
- Number of Conversions: This is your North Star. For e-com, it’s purchases. For lead-gen, it’s form submissions or booked calls. Track total volume over a set period (e.g., last 30 days, quarter-to-date). Why? Volume shows scale; if it’s flatlining while spend increases, something’s broken.
- Conversion Rate: Percentage of visitors or leads that turn into paying customers. Aim high; industry benchmarks vary, but for paid traffic, 2-5% is common; organic might be higher. In the dummy dash, we targeted 6%+. Low rates scream issues like poor landing pages or mismatched targeting.
- Total Revenue: Raw dollars generated. Break it down by channel to see who’s pulling weight. Don’t just celebrate big numbers; contextualize with costs.
- Average Order Value (AOV): Revenue divided by conversions. Boost this with upsells, bundles, or better customer segmentation. If AOV drops, investigate pricing or product mix.
Then, layer in efficiency metrics:
- Cost Per Acquisition (CPA): How much to acquire one customer/lead. Target: As low as possible without sacrificing quality. In the video example, we aimed under $35. If it’s creeping up, pause and diagnose; maybe ad fatigue or rising competition.
- Return on Ad Spend (ROAS): Revenue divided by ad spend. For paid channels, shoot for 4-7x+ depending on margins. Anything under 2x? Red flag; you’re losing money.
These are your business’ vital signs. Use gauges or color-coding (green for good, red for critical) to make them visual. Pro tip: Set benchmarks based on historical data or industry standards, but adjust for your reality. A startup might tolerate higher CPA for growth; a mature biz wants efficiency. Having a single source of truth for your data makes this analysis much more reliable.
Drilling Down: Channel-Specific Performance and Insights
Once you’ve got the big picture, zoom in. This is where most dashboards fall short: they either lump everything together or are too granular. You can break it out by paid vs. organic, then by platform.
Paid Channels: Where the Money’s at Stake
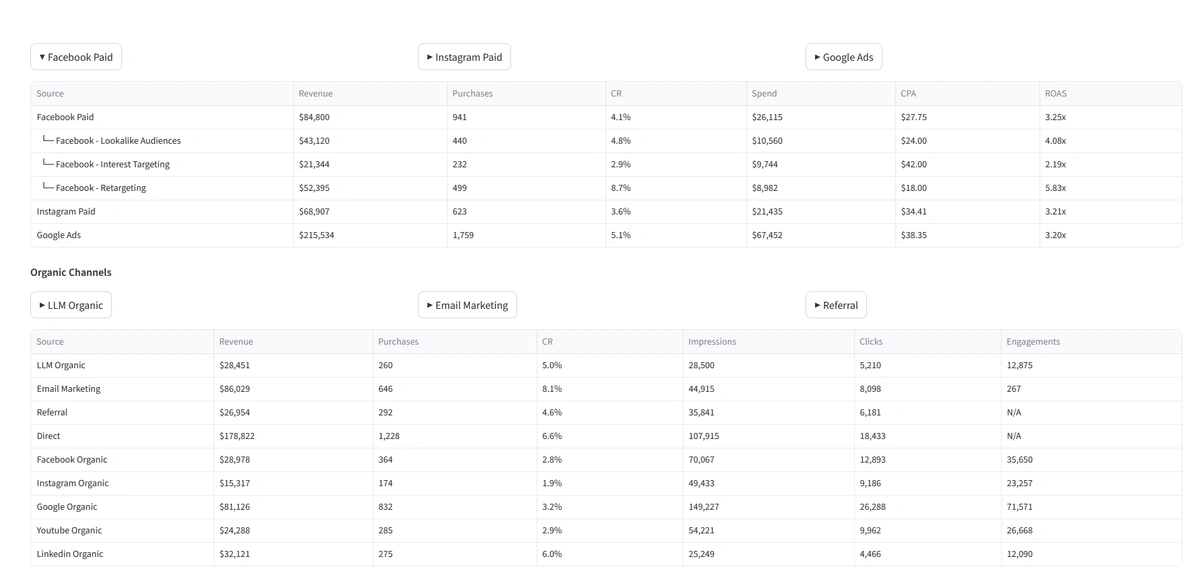
Paid ads (Facebook, Instagram, Google, etc.) are easy to track but tricky to optimize without depth. In the video, for example, we expanded on Facebook Paid: Overall ROAS was 3.38x, but drilling down showed:
- Lookalike Audiences: Crushing it at 4x+ ROAS. These use your best customers to find similar folks; double down here.
- Interest Targeting: Lagging at half that. Maybe the interests are too broad; test narrowing them.
- Retargeting: Best performer. Warm audiences convert better; allocate more budget.
Do this for every campaign. Look at spend, impressions, clicks, but always tie back to conversions and revenue. Best practice: Use UTM parameters for tracking. Tools like Google Analytics or Mixpanel can attribute properly, showing multi-touch journeys (e.g., Facebook ad > email click > purchase).
For Google Ads: Focus on search vs. display. Search often has higher intent, so expect better conversion rates. Instagram? Visual-heavy, so test creatives rigorously.
In-depth tip on attribution: Default to last-click (credits the final touchpoint), but that’s flawed; it ignores upper-funnel awareness. Switch to data-driven attribution in Google Analytics, which uses machine learning to weigh each touch. If you’re on Facebook, enable their pixel for cross-device tracking. Without this, you’re undervaluing channels like display ads that build awareness.
Organic Channels: The Long Game
Organic is squishier; no direct spend, but massive potential. Track referrals from:
- Search engines (Google organic, Bing organic)
- Social (LinkedIn, Reddit, X)
- AI tools (ChatGPT, Perplexity, Grok)
- Email campaigns
- Referrals: Product Hunt, Hacker News, any other website
Metrics here: Engagements (shares, comments) are okay for awareness, but prioritize conversions, revenue, and conversion rate per source. In the dummy dash, we saw revenue by traffic source; Google Ads led, but direct traffic (repeat visitors?) was close behind.
Best practice: Use event tracking in analytics tools. For email, track open rates (20-30% benchmark), but obsess over click-to-conversion. Tools like Klaviyo or Mailchimp integrate with e-com platforms for end-to-end.
Deeper dive: Organic often has longer cycles. Use cohort analysis; group users by acquisition date and track lifetime value (LTV). If Reddit drives high-LTV users despite low volume, invest more in community building. This approach aligns with the digital marketing trends shaping 2026 where first-party data becomes your lifeline.
Visualizing It All: Graphs, Trends, and Budget Analytics
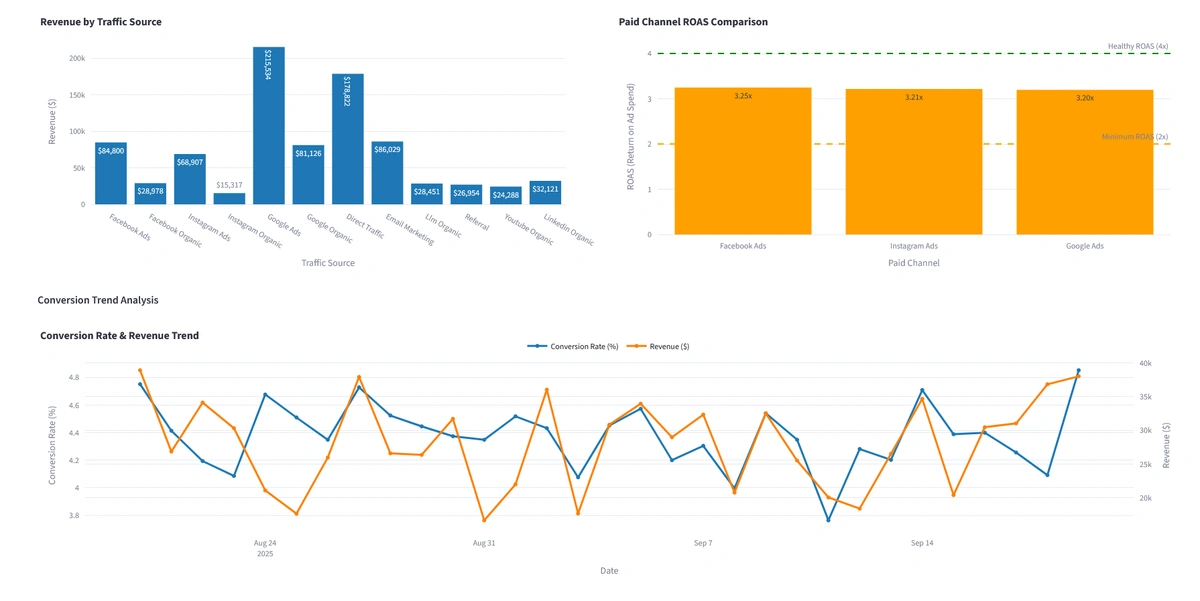
Data without visuals is noise. In the video, we had:
- Revenue by Traffic Source Pie Chart: Shows distribution; e.g., Google Ads 40%, direct 25%. Use this to reallocate budget.
- ROAS Bar Graphs: Per paid channel. Spot underperformers quickly.
- Conversion Rate to Revenue Line Graph: Over time (e.g., 30 days). Look for correlations; did a campaign spike conversions?
Then, the underrated part: Budget vs. Actual Spend.
This pulls in everything; ad budgets, tool costs (CRM like HubSpot, email like SendGrid), even headcount if marketing-heavy. Track monthly/quarterly:
- Budget Efficiency: Spent vs. allocated (aim 90-110% to avoid underspend).
- Quarterly Revenue: Tied to spend for ROI calc.
Add an “Insights” section: Jot notes like “Q2 revenue bump from retargeting campaign; scaled 2x.” This turns data into stories for team alignment.
Tools for this: Looker Studio (free), Tableau (robust), or agency dashboards like ours at lilAgents that integrate AI for predictive insights.
Going Deeper: Best Practices for Measurement That Drive Real Results
Alright, this is where we’ll expand big time beyond the video. Measurement isn’t passive; it’s an active process that informs every decision. Here’s our in-depth guide, drawn from years of trial and error.
1. Build a Robust Tracking Foundation
- End-to-End Attribution: As mentioned, last-click sucks for complex funnels. Use multi-touch models: Linear (equal credit), time-decay (more to recent touches), or position-based (40% first/last, 20% middle). Test in Google Analytics 4 (GA4); it’s free and powerful.
- Pixel and Tag Management: Install Facebook Pixel, Google Tag Manager. Track events like add-to-cart, not just page views.
- UTM Tagging: For every link. Example: utm_source=facebook&utm_medium=cpc&utm_campaign=lookalikes. This segments traffic accurately.
- Privacy Compliance: With iOS14+ and cookie deprecation, use server-side tracking (e.g., via Google Cloud) to bypass blockers. Tools like Stape or Elevar help.
Common pitfall: Data silos. Integrate everything; use Zapier or native APIs to pipe data into one dashboard.
2. Experimentation and A/B Testing: The Engine of Optimization
In the video, we touched on testing; let’s go granular.
-
The Two-Week Rule: Launch new (ad, email, post) for 14 days to gather baseline data. Why two weeks? Enough for statistical significance without dragging.
-
A/B Testing Framework:
- Hypothesis First: “Changing subject line from ‘Sale Alert’ to ‘Unlock 20% Off Now’ will boost opens by 15%.”
- One Variable at a Time: Test headline, image, CTA, timing; isolated.
- Sample Size: Use calculators (e.g., Optimizely’s) to ensure validity. Aim for 80% confidence.
- Tools: Google Optimize (free, sunsetting soon; switch to VWO), Facebook’s built-in splits, or email platforms’ A/B features.
-
Multivariate Testing: Once basics are nailed, test combos (e.g., headline + image). Requires more traffic.
-
Iteration Cycle: Winner becomes control; test again. Always have 10-20% budget for experiments.
Example: For organic blog posts, A/B headlines via tools like Thrive Headline Optimizer. Track not just traffic, but time-on-page and conversion to lead.
3. Advanced Metrics and Analysis Techniques
- Customer Lifetime Value (LTV): Revenue per customer over time. Formula: AOV x purchase frequency x lifespan. Compare to CPA; if LTV > 3x CPA, you’re golden.
- Churn Rate: For subscriptions; monthly lost customers. Tie to marketing: High churn from paid? Bad targeting.
- Marketing Efficiency Ratio (MER): Total revenue / total marketing spend. Simpler than ROAS for holistic view.
- Predictive Analytics: Use AI (like in GA4) to forecast trends. Spot anomalies; e.g., sudden CPA spike from ad policy change.
- Segmentation: Break data by demographics, device, geography. Mobile users convert lower? Optimize for that.
4. Tools and Tech Stack Recommendations
No one-tool-fits-all, but start simple: Google Analytics and Looker Studio. They’re free to start.
Budget tip: Allocate 10-15% of marketing spend to tools. ROI? Massive; better data means smarter decisions.
5. Common Mistakes and How to Avoid Them
- Over-Reliance on Vanity Metrics: Impressions? Useless alone. Always ask: Does this drive revenue?
- Ignoring External Factors: Seasonality, economic shifts; use benchmarks to normalize.
- Data Overload: Start with 5-10 KPIs; expand as you mature.
- No Actionable Insights: Data without decisions is waste. Weekly reviews: What worked? Scale/kill/tweak.
6. Scaling Measurement as You Grow
For small teams: Manual Excel pulls.
Mid-size: Automated dashboards. Enterprise: AI-driven predictive modeling.
Always audit quarterly: Is tracking accurate? Tools updated?
Wrapping It Up: Why This Matters for Your Business
If you’ve made it this far, you’re ahead of 90% of marketers. The point? Measurement isn’t about looking at pretty visuals; it’s about proving value, justifying spend, and guiding strategy. A solid dashboard like the one we described turns guesswork into growth. It shows where to double down (like that killer retargeting campaign) and what to ditch (underperforming interests).
If you’re struggling with this, whether building from scratch or optimizing existing efforts, think about how a partner like lilAgents can help accelerate. We’re built on lean, experienced foundations, blending human insight with AI to make this stuff seamless. You can start small: Grab that two-week test template we mentioned earlier, build a basic dashboard, and iterate. Explore our services to see how we can help you build a measurement system that drives real results.
Gain clarity on measuring the return-on-investment of your marketing efforts. Reach out to us for a free audit and demo of the insights you could be gaining about your business.
Schedule a Free ConsultationMarketing ROI FAQs
What is ROI in Marketing?
ROI in marketing measures the profitability of your marketing investments. It calculates the revenue generated from campaigns minus the costs, expressed as a percentage. This metric helps businesses evaluate whether their marketing activities are driving growth or draining resources. For example, if a $1,000 campaign brings in $4,000, your ROI is 300%. It’s essential for data-driven decision-making.
What is a Good Marketing ROI?
A good marketing ROI varies by industry and channel, but generally, anything above 4:1 (or 400%) is considered strong. For e-commerce, aim for 5:1 or higher due to direct sales tracking. In B2B, where sales cycles are longer, 3:1 might be acceptable. Benchmarks depend on factors like customer lifetime value; always compare against your historical performance and goals.
How to Improve Marketing ROI?
To improve marketing ROI, focus on targeting high-value audiences, optimizing ad spend through A/B testing, and nurturing leads with personalized content. Automate routine tasks with AI tools to reduce costs, and regularly audit campaigns to cut underperformers. Integrating multi-channel attribution ensures you’re crediting the right efforts, leading to more efficient resource allocation and higher returns.
How to Determine ROI in Marketing?
Determining ROI in marketing involves tracking key metrics like revenue attributed to campaigns, total costs (including creative, media, and tools), and conversion rates. Use tools like Google Analytics for attribution modeling. Start by setting clear goals for each initiative, then compare net profit to investment. This process reveals which strategies align with your business objectives.
How to Calculate Marketing ROI?
To calculate marketing ROI, use the formula: (Revenue from Marketing - Cost of Marketing) / Cost of Marketing x 100. For instance, if a campaign costs $10,000 and generates $50,000 in sales, ROI is ($50,000 - $10,000) / $10,000 x 100 = 400%. Include all indirect costs like staff time for accuracy, and factor in long-term value for subscriptions or repeat business.
How Do You Measure ROI in Account-Based Marketing?
Measuring ROI in account-based marketing (ABM) focuses on account-level metrics like pipeline velocity and deal size from targeted accounts. Track engagement (e.g., content downloads, meeting bookings) and attribute revenue to specific accounts using CRM tools like HubSpot. Calculate as (Revenue from Targeted Accounts - ABM Costs) / ABM Costs. Success often shows in higher close rates and larger deals compared to broad marketing.
How to Measure Content Marketing ROI?
To measure content marketing ROI, track metrics such as organic traffic growth, lead generation, and sales influenced by content (e.g., blog-to-purchase conversions). Use UTM tags and analytics to attribute value. The formula mirrors general ROI: (Attributed Revenue - Content Creation Costs) / Costs x 100. Tools like Ahrefs or Google Analytics help quantify long-term SEO benefits and engagement leading to revenue.
How Digital Marketing Improves ROI for Small Businesses?
Digital marketing boosts ROI for small businesses by offering cost-effective targeting, real-time analytics, and scalable campaigns. Channels like SEO and social media ads allow precise audience reach without massive budgets, while email automation nurtures leads efficiently. With lower entry barriers than traditional media, small businesses can test quickly, iterate based on data, and achieve higher returns through personalized, measurable interactions. For local businesses like dentists, our local SEO guide shows how to maximize ROI with targeted strategies.
How Can a Business Assess the ROI from Influencer Marketing?
To assess influencer marketing ROI, monitor metrics like reach, engagement rates, and traffic/revenue driven by unique promo codes or affiliate links. Calculate (Incremental Sales - Influencer Fees and Production Costs) / Total Costs x 100. Use tools like Google Analytics for attribution and track brand sentiment via social listening. Long-term benefits include audience trust, which can amplify future campaigns.
Can You Measure the ROI of Your Social Media Marketing?
Yes, you can measure social media marketing ROI by tracking conversions from platform-specific links, such as purchases or sign-ups via UTM parameters. Key metrics include engagement-to-sale ratios and cost per engagement. Use platform insights (e.g., Facebook Pixel) alongside Google Analytics for full-funnel attribution. Formula: (Revenue from Social - Social Ad Spend and Content Costs) / Costs x 100. Focus on both immediate sales and brand awareness for a complete view.
What Role Does Customer Lifetime Value Play in Marketing ROI?
Customer Lifetime Value (CLV) enhances marketing ROI by shifting focus from single transactions to long-term profitability. Calculate CLV as average purchase value x purchase frequency x customer lifespan, then compare to acquisition costs. High CLV justifies higher upfront spend on retention-focused campaigns, improving overall ROI through repeat business and reduced churn.
How Does SEO Contribute to Long-Term Marketing ROI?
SEO drives long-term marketing ROI by generating organic traffic that compounds over time without ongoing ad spend. Measure through metrics like keyword rankings, organic conversion rates, and revenue from search referrals. Initial investments in content and optimization yield sustained returns, often achieving ROIs exceeding 1000% after the first year, as traffic builds passively. See how one law firm improved SEO without writing new posts for a real-world example.
What Are Common Pitfalls in Measuring Marketing ROI?
Common pitfalls include ignoring indirect costs (e.g., staff time), relying on last-click attribution which undervalues upper-funnel efforts, and not accounting for seasonality. Overlooking multi-channel interactions or vanity metrics like likes can skew results. Avoid these by using advanced attribution models and holistic tools to ensure accurate, actionable insights.
How Can AI Tools Enhance Marketing ROI?
AI tools improve marketing ROI by automating personalization, predictive analytics, and optimization at scale. For example, AI-driven ad platforms adjust bids in real-time for better targeting, while chatbots handle leads efficiently. This reduces manual labor costs and boosts conversion rates, potentially increasing ROI by 20-50% through data-informed decisions and hyper-relevant campaigns. The AI and technology trends in 2026 are making these tools more accessible than ever.
What is the Impact of Email Marketing on Overall ROI?
Email marketing often delivers high ROI, averaging 36:1, due to low costs and direct customer access. Track opens, clicks, and attributed sales using automation platforms. Its impact on overall ROI comes from nurturing leads and driving repeat purchases, complementing other channels by providing measurable, personalized touchpoints that build loyalty and revenue.
How to Track ROI in B2B Marketing Campaigns?
In B2B marketing, track ROI by monitoring lead quality, sales pipeline progression, and closed-won deals from campaigns. Use CRM integration to attribute revenue accurately. Calculate as (B2B Revenue Generated - Campaign Costs) / Costs x 100, factoring in longer cycles. Focus on metrics like MQL-to-SQL conversion rates for a clear picture of efficiency.
What Metrics Beyond Revenue Indicate Strong Marketing ROI?
Beyond revenue, metrics like Customer Acquisition Cost (CAC), payback period, and marketing-qualified leads (MQLs) indicate strong ROI. Low CAC relative to CLV, quick payback (under 12 months), and high MQL quality show sustainable growth. These provide a fuller view, ensuring marketing not only drives sales but supports scalable, profitable expansion.
How Does Personalization Affect Marketing ROI?
Personalization boosts marketing ROI by increasing engagement and conversions—studies show up to 20% higher sales. Tailor content, emails, and ads based on user data to reduce waste and enhance relevance. Measure through segmented campaign performance; the result is lower churn and higher CLV, making personalized efforts a high-ROI strategy for modern marketing.
What is the ROI of Video Marketing for Brands?
Video marketing ROI can reach 4-6x through higher engagement and shareability, driving traffic and conversions. Track views, watch time, and linked actions like sign-ups. Costs include production, but platforms like YouTube offer organic reach. For brands, it excels in storytelling, yielding strong returns on awareness and direct response campaigns.
How to Report Marketing ROI to Stakeholders Effectively?
To report marketing ROI effectively, use clear visuals like dashboards showing key metrics, trends, and forecasts. Tie data to business goals with narratives explaining wins and learnings. Tools like Google Data Studio simplify this. Focus on actionable insights, such as ROI by channel, to build trust and secure buy-in for future initiatives.